N+B+K+V+G+C = Self-Hosted Analytics
In this article will discover a event-driven-stream-based way to create analytics solutions like Google Analytics, Plausible, Aptabase and other using only existing tools.
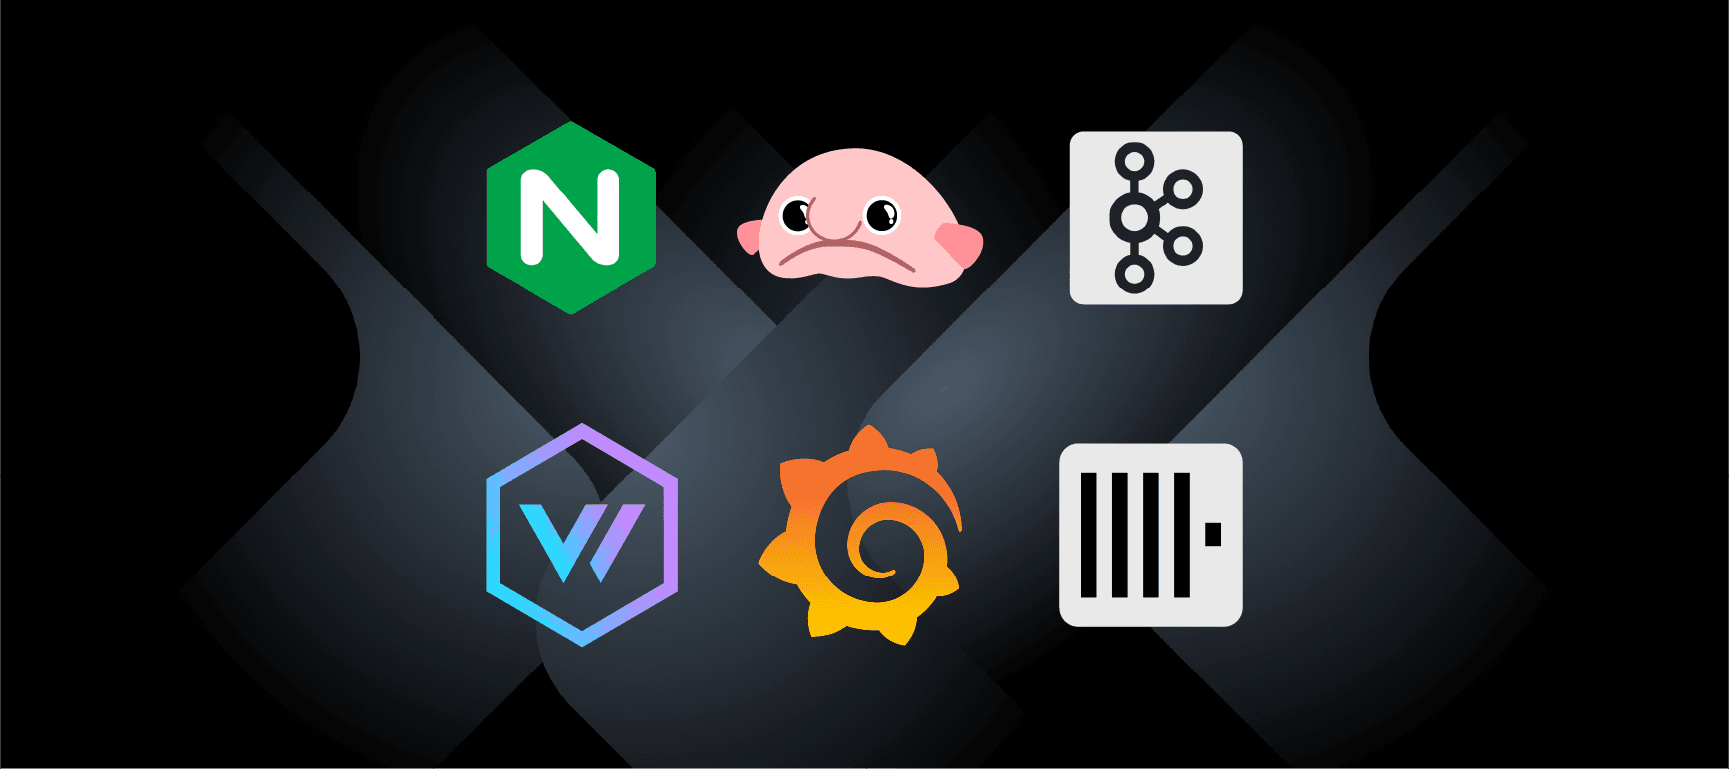
We'll use the following tools for creating a self-hosted analytics system.
| Tool | Purpose |
| Nginx | Revers proxy: the main endpoint, and rate limiter |
| Benthos | Stream processor: gather analytics events |
| Kafka | Event store: stores all events |
| Vector | Log aggregator: aggregate the logs to put into the OLAP database |
| Grafana | Dashboard: view all the data in real-time and history browsing |
| Clickhouse | OLAP database: long-term storage for the events |
The requirements for this article are to have general knowledge in:
Docker & Docker Swarm
Nginx
and, Stream processing in general.
The Idea
When utilizing existing tools together we'll be able to have a production ready product. And, all what we need to do is to just update the underlying technologies being in used.
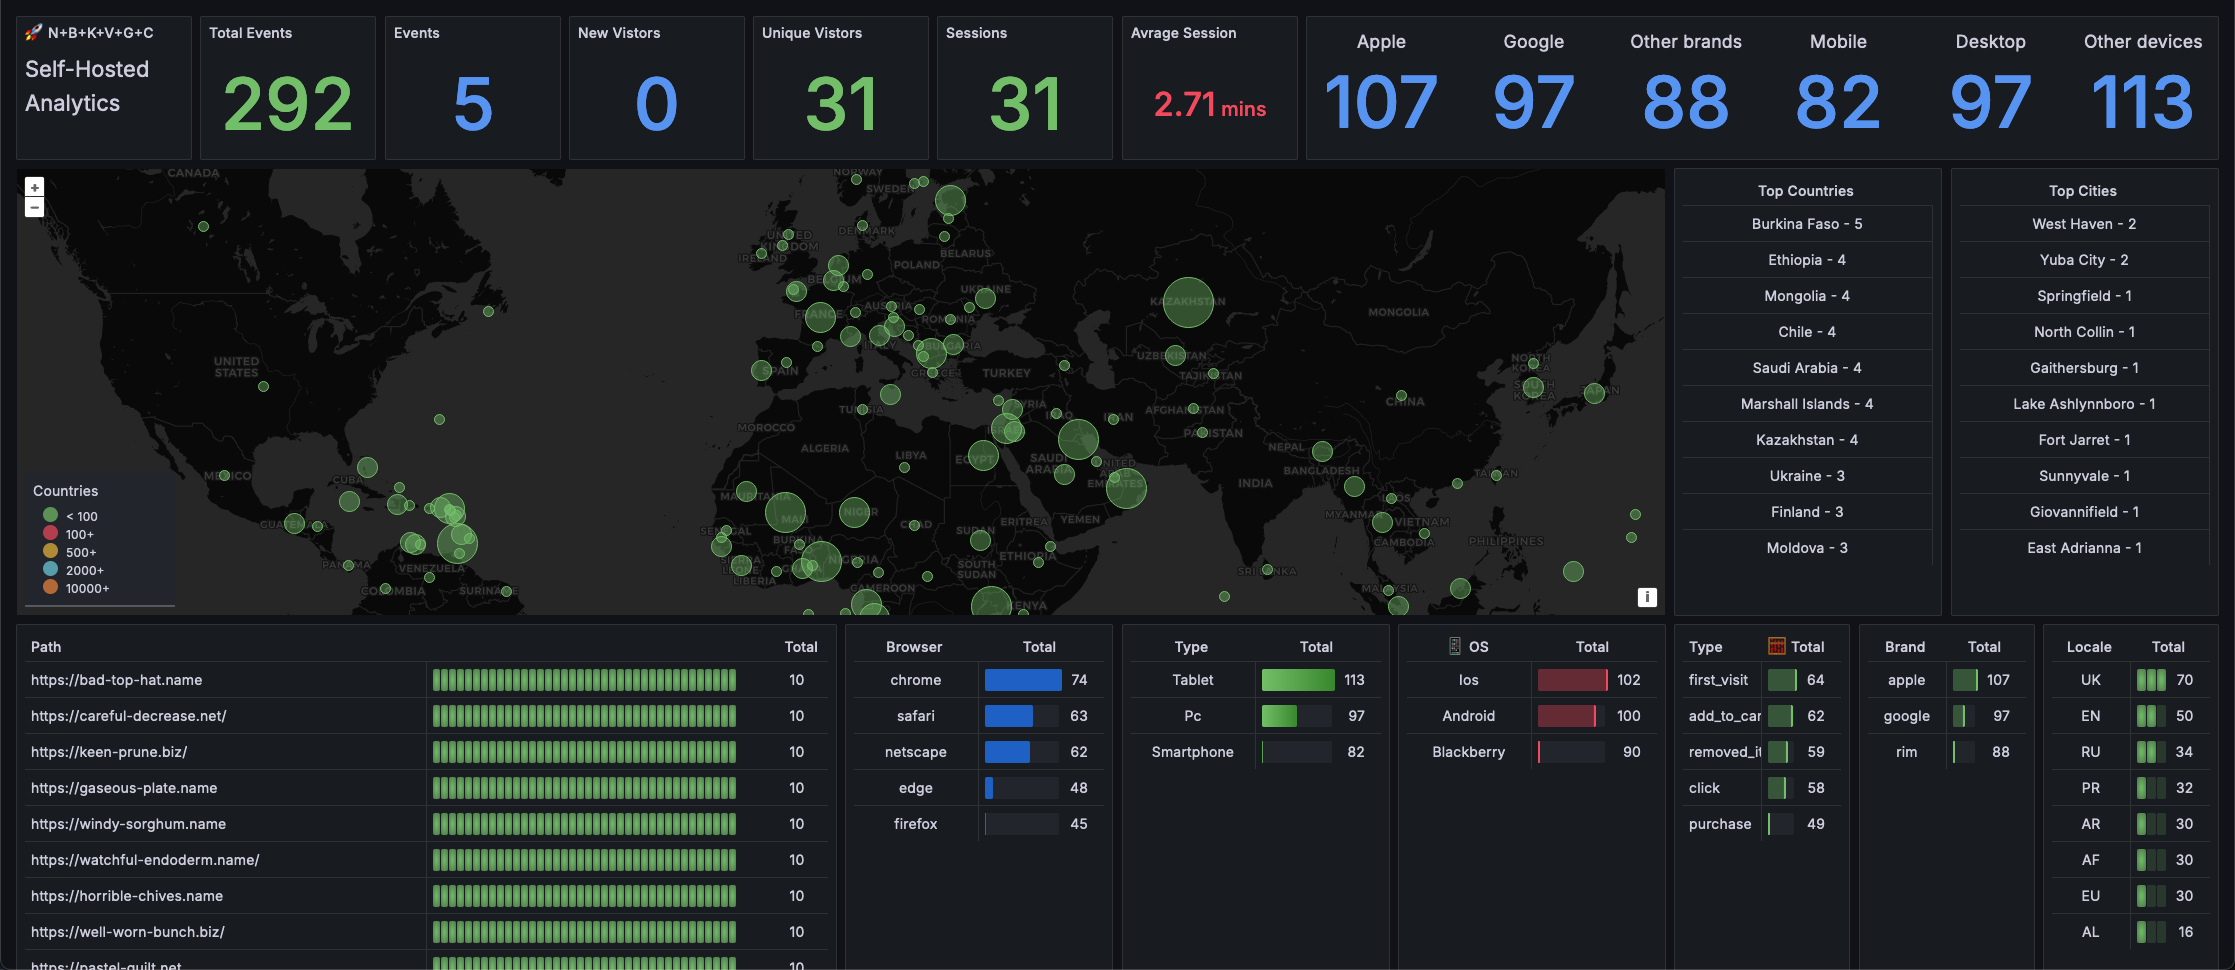
Here's the end results 👇
Why?
The main advantage of self-hosting solutions is to have control over the data.
The second, it's usually cheaper.
Last advantage, this type of production environment scaled easily, meaning, you need a wider throughput? just add more nodes containing the same services and put it all behind a load balancer.
Architecture
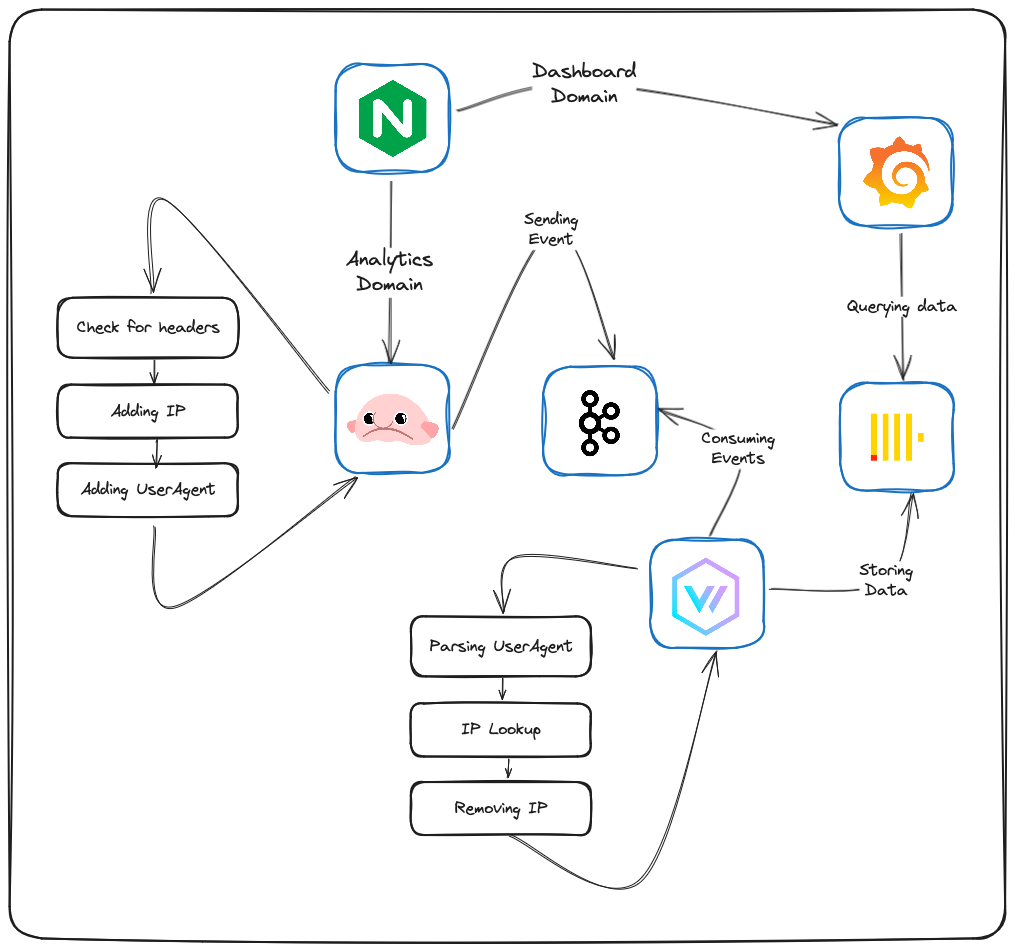
First, will use nginx as the only direct endpoint to the server. nginx will reverse proxy each request based on the domain to one of two inner endpoints:
benthosfor event capturinggrafanafor accessing the analytics dashboard
benthos will have http_server input configured to handle incoming requests. Then, benthos will check to see if the message is indeed for the app, and will add some meta data, then it will deliver (produce) the data directly to a kafka topic, and response with 201 (empty successful response) to the user immediately.
The reason for that is to make sure the event capturing process will fast as possible, between 10-50ms total! sending the event to kafka is a good way to ensure just that.
On the other hand we have a vector container subscribed to the kafak topic for receiving the events. vector will process each event and will add them to OLAP database.
In the process vector will parse the user-agent, the user country and other event details.
Then, the management-user can access the grafana dashboard to view data in real-time or to filter by dates.
vector or bentos for both parts of the streaming process. The use of two different services was for becoming familiar with both technologies.Deployment Steps
In the lab repo you can find
terraformfiles for one-liner deployment ofN+B+K+V+G+Cstack to Hetzner and Cloudflare (for DNS).
Files and Folders
Clone the lab repo and cd into 01-your-own-analytics/docker. You will see these files.
docker-compose.ymlThe main architecture file.envContains all necessary environment variables as Database passwords, etc.nginx/analytics.confContains nginx config file for analytics endpoint with rate-limit of 60 requests per second.nginx/dashboard.confContains nginx config file for Grafana dashboard endpoint.bentohs/config.yml- Benthos config filevector/config.yml- Vector config filevector/mmdb- MindMap GeoLite database.grfana/dashboards/*.jsondashboards settingsgrfana/provisioning/dashboards/clickhouse.yamlDashboards loading instructions.grfana/provisioning/datasources/clickhouse.xmlClickhHouse datasource settings.scripts/install.tsInstaller script for creating ClickHouse database and table.(Optional)
scripts/seed.tsSeeding a year-worth of dummy data.
We use docker-compose.yml file to describe the architecture for ease of use, and it would be suitable for most use-cases. in large environment you'll probably use Docker Swarm or a fully blown Kubernetes environments.
The project contains a justfile which its a simple script runner or "just is a handy way to save and run project-specific commands."
You can download the right one for your system here.
For local development with just you can run, you'll be ask for password, this is for editing your hosts file, check inside the justfile for more details.
just install-local
To remove everything, run
just remove
Now, let's go through the deployment process.
Setting nginx endpoints
First, we need to update the domains inside nginx/analytics.conf and nginx/dashboard.conf files. Here's the analytics configuration for example.
limit_req_zone $binary_remote_addr zone=base_limit:10m rate=5r/s;

server {
  ...
  server_name analytics.test;

location / {
    limit_req zone=base_limit;
    ...
    proxy_pass http://input-pipeline:4195;
   }
}
You can also notice that we are setting rate-limit for the analytics endpoint only, as we want to prevent abuse against the endpoint from which we are gathering data.
The rate limit settings are, 5 Requests per second for given IP.
As for the dashboard endpoint it's recommended putting it behind Firewall or a different type of blocker as CloudFlare ZeroTrust which is free up to 50 users.
Env file
Inside the .env file you can set strong password and different usernames for the databases. The only field you might want to change is PROJECTS
PROJECTS=app,website
This variable contains list of projects names. This project names will be in use when you will create events.
Installation
Now, we can start everything by running
docker compose up -d
Creating Kafka topic.
Run this command to execute binary inside the kafka container to create Kafka topic named analytics with 7 days message retention, after that Kafka will delete them.
docker exec event-store kafka-topics.sh \
--create --topic analytics \
--config retention.ms=604800000 \
--bootstrap-server localhost:9092
Now it's better to restart the vector container as the topic didn't exist till now.
docker compose restart vector
Creating Clickhouse table
Run this command to create Clickhouse table.
export $(grep -v '^#' .env | xargs) \
&& docker run --rm  \
--env CLICKHOUSE_HOST --env CLICKHOUSE_USER --env CLICKHOUSE_PASSWORD \
--env CLICKHOUSE_PROTOCOL --env CLICKHOUSE_PORT --env CLICKHOUSE_DB \
--network=analytics \
-v ./scripts:/app oven/bun bun /app/install.ts
This command will run the typescript file using bun runtime.
Optional - seed some demo data
To see the dashboard with data while browsing you can run the following command to seed years worth of data into the database.
export $(grep -v '^#' .env | xargs) \
&& docker run --rm  \
--env CLICKHOUSE_HOST --env CLICKHOUSE_USER --env CLICKHOUSE_PASSWORD \
--env CLICKHOUSE_PROTOCOL --env CLICKHOUSE_PORT --env CLICKHOUSE_DB \
--network=analytics \
-v ./scripts:/app oven/bun bun /app/seed.ts
Create your first event(s)
Now we are ready to create our first event. we'll use curl to POST an event to our Benthos (through nginx) endpoint.
curl --location 'http://analytics.test' \
--header 'X-App: app' \
--header 'Content-Type: application/json' \
--data '{
    "type": "click",
    "user_id": "1",
    "session_id": "FaAa31",
    "timestamp": "2024-04-17T04:04:12",
    "locale": "en",
    "path": "/getting-started",
    "appVersion": "0.0.1",
    "details": {
        "meta_a": "meta_a",
        "meta_b": "meta_b"
    }
}'
or JavaScript fetch for example
const body = JSON.stringify({
  "type": "click",
  "user_id": "1",
  "session_id": "FaAa31",
  "timestamp": "2024-04-17T04:04:12",
  "locale": "en",
  "path": "/getting-started",
  "appVersion": "0.0.1",
  "details": {
    "meta_a": "meta_a",
    "meta_b": "meta_b"
  }
});

await fetch("http://analytics.test", {
  method: "POST",
  headers: {
    "X-App": "app",
    "Content-Type": "application/json"
  },
  body,
});
User ID vs Session ID
User ID is an identifier that you'll try to maintain as long as you can as this is the way you can different between users, for mobile you can use some device id like identifierForVendor in iOS, and AndroidID for Android. In web, you can store random unique ID inside the browser Local Storage.
Session ID on the other hand is only for short period of time, for that you can create a random unique id combined with the current user ID and store it in memory. In the browser you can also store it inside Session Storage.
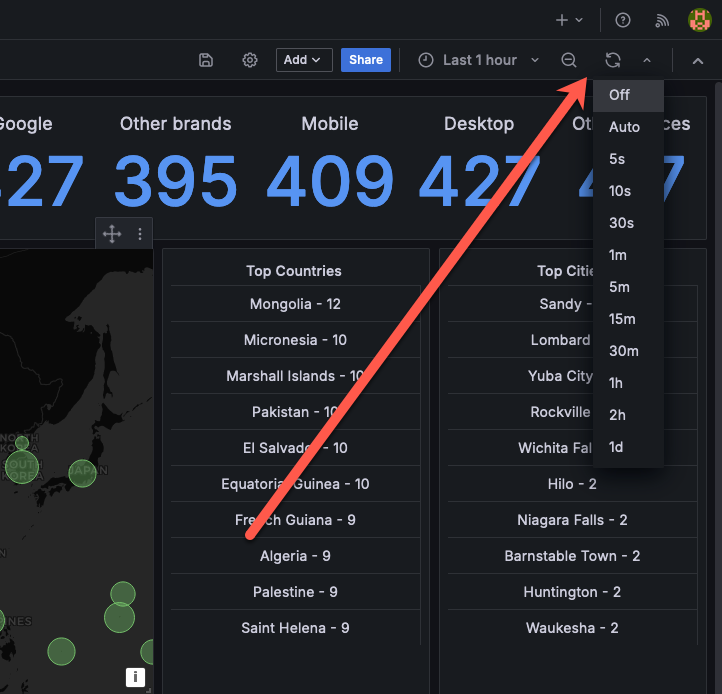
View the data in Grafana
Now access your Grafana. For the first time you'll to login using admin as username and password. Then, you'll be prompted to change the password.
You can also see events occurring in real-time by enabling Grafana auto load from the upper top right.
That's it!
ClickHouse is very! efficient, 119,716,577 rows weight total of 21.91GB, but, on disk it's compressed and weight only 4.93GB!
You can deploy a N+B+K+V+G+C stack on a € 16.18 server at Hetzner and get
4 vCPU
8GB RAM
160GB SSD
and 20TB! Bandwidth,
To have that number of events you'll need to create 9,976,381 events a month, or 332,546 events a day, or 3-4 events in a given second.
This deployment of N+B+K+V+G+C its just simple example, and, you can of course adapt it to your needs.
🪄 Expelliarmus!